Projects
1 - SALES REPORT
2 - ROAD ACCIDENTS ANALYSIS 2021/2022
3 - HR REPORT DASHBOARD


SALES REPORT
Business Demand Overview:
-
Reporter: Steven – Sales Manager
-
Value of Change: Visual dashboards and improved Sales reporting or follow up or sales force
-
Necessary Systems: Power BI, CRM System
-
Other Relevant Info: Budgets have been delivered in Excel for 2021
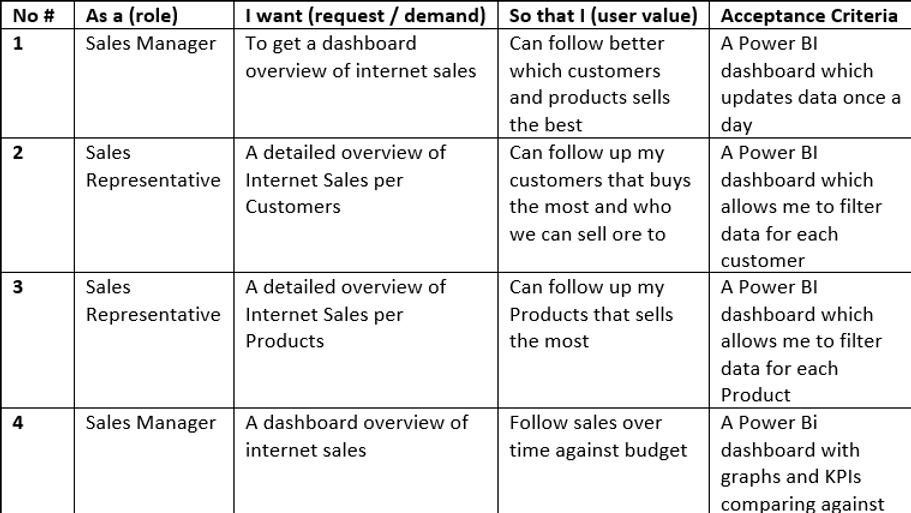
User Stories


Data Cleansing and Transformation (SQL)
To create the necessary data model for doing analysis and fulfilling the business needs defined in the user stories the following tables were extracted using SQL.
Project File Link
PDF Link

Road Accidents Data Analysis
Project Requirements
Clients wants to create a Road Accident Dashboard for year 2021 and 2022 so that they can have insight on the below requirement.
-
Primary KPI – Total Casualties and total accidents values for current year and YoY growth.
-
Primary KPI’s – Total Casualties by accident severity for current year and YoY growth.
-
Secondary KPI’s – Total Casualties with respect to vehicle type for current year
-
Monthly trend showing comparison of casualties for current year and previous year.
-
Casualties by Road type for current year
-
Current year Casualties by area/location and by day/night
-
Total casualties and total accidents by location.
Stakeholders
-
Ministry of transport
-
Road Transport Department
-
Police Force
-
Emergency Service Department
-
Road Safety Corps
-
Transport Operators
-
Traffic Management Agencies
-
Public
-
Media
